
How To Boost JavaScript Runtime Performance

Oct 6, 2020 · 17 min read
There’s lots of advice, but it seems to taper off when it comes to advanced performance tactics. I’ve read the articles, but it’s either too vague, too broad, or just basic stuff I have already done. Where are the more advanced articles on performance, most importantly — why are we not combining tech and talking about a stacked implementation?
This has been my real-world experience, tools, or tactics I've used. I like web performance and am a little obsessed. These ideas can be a little quirky or abstract, there are probably better ways to handle perf.
With that said…
The Basics
Let's get these out the way, mostly common sense and typical perf suggestions.
- Use Brotli
- Use http2
- Use webp and a CDN that can dynamically resize and serve the most efficient formats
- Code split your app
- Utilize edge networks
- Don’t preload videos, don’t autoplay videos until intersection observer is activated.
- Use CSS and JS optimization
- Tweak webpack chunking to reduce cache misses when redeploying
- Trim the tag manager, move really static code into your own <head>
Lazy-load images with intersection observer
Responsive images, lazy-loading, and intersection observer.
This component can speed up load times. Especially if a page consists of multiple images, even small ones. Image requests can block up the network priority. I try not to lazy load the first image in a carousel depending on where it is in the fold. You want to leave some margin when using intersection observer so there's enough scrolling time left for resources to be loaded just before view
It's important to note that IntersecionObserver v1 cannot determine opacity or height:0 as being hidden still, so make sure to display none collapsed content that technically is still in view, at height 0. The same applies to z-index.
Use resource hints against third party domains
There is a lot of third party tags on most production environments. preconnecting domains and preloading critical tags will cut down on HTTP handshakes and RTT in general. HTTPS and DNS resolution can take up to 200ms.
I'm pretty sure this repo has a bug in it. But something like this is very useful to dynamically create resource hints. It's especially useful when combining with other performance tactics, like Gate
Advanced Tactics
With a quick overview of some basic perf improvements. Let's look at some other perf improvements.
Use requestIdleCallback on anything heavy.
Executing code during idle time is a great way to reduce runtime overhead. I'll often wrap componentDidMount or componentDidUpdate in idleCallback. Especially when mounted code executes anything heavy, like objectFitImages polyfills or event handler callbacks.
Idle callback schedules background execution at some point in the near future. Usually within a few milliseconds after being created. It's a useful way to reduce long-running function times. Some code can run without blocking the event loop.
Idle Callback is very useful when combined with other performance tactics, there's also plenty of idle-callback polyfills to take advantage of.
Use Network Idle callbacks
Running heavy operations when the network is determined idle, similar to TTI callbacks. I've not tried this since TTI does most of what I need.
Pre-heating
Pre-heating can be used in a few ways. The core concept is to separate code loading from its execution. Giving the environment an opportunity to “warm-up” before immediately having to go from network, parse, compile to execution.
const modulesToHeat = [
 () =\> require("react-dom"),
 ()=\> require('moment'),
 ()=\>require('heavyvendor'),
 ()=\>require('./App')
 ]
function getInSequence(array, asyncFunc) {
 return array.reduce((previous, current) =\> (
 previous.then(accumulator =\> (
 asyncFunc(current).then(result =\> accumulator.concat(result))
 ))
 ), Promise.resolve([]));
}getInSequence(modulesToHeat,(warm)=\>new Promise((resolve)=\>{
 requestIdleCallback(()=\>{
 resolve(warm())
 })
)).then(()=\>{
 // you could use the library in the promise. But if App contained the mount and render function as well.
 const ReactDOM = require('react-dom')
 const App = require('./App')
 ReactDOM.hydrate(App,DOMNode)
})
Such a tactic improves initial paint and render time since the main thread is not immediately slammed with requiring and executing code on the same tick. Preheating can get you paint and render times under 50ms.
This tactic can be retrofitted to third party tags. The pre-heat would use dynamic resource hints followed by creating a script tag in idleCallback ticks. This mechanism works best when combined with how Gate works against unblocking third party tags
I use a similar tactic when using Module Federation.
function preloadComponent(scope, module) {
 return async () =\> {
 // Initializes the share scope. This fills it with known provided modules from this build and all remotes
 await \_\_webpack\_init\_sharing\_\_("default"); const container = window[scope]; // or get the container somewhere else
 // Initialize the container, it may provide shared modules
 await container.init(\_\_webpack\_share\_scopes\_\_.default);
 // the chunk is downloaded
 const factory = await window[scope].get(module); return factory;
 };
}const preload = preloadComponent(scope,module)setTimeout(()=\>{
 preload.then(factory=\>{
 // the factory is called, which returns module.exports const Module = factory()
 Module.default('someData') })
},100)
IdleCallback can be implemented, but since module federation is async under this implementation — you should preload future modules somewhere higher up in the application lifecycle. Combining with intersection observer, you can perform preloading before the module has to be called.
Reprioritize third party code
Read about it seperately. Gate had been the largest performance improvement I’ve seen.
Partial and Lazy Hydration
You can drastically improve internal application performance by only hydrating part of the application. Since you usually only need some of a page to be interactive, like above the fold content. Everything else can remain as static markup from SSR. We can then hydrate additional react components with intersection observer, idle callback, or not at all — leaving the markup static.
React hydration can be an extensive operation. The less we need to hydrate upfront, the faster the hydration process will complete.
When combined with Gate lifecycle hooks we can hydrate low priority components after TTI has been reached.
A good combo is whenVisible or on TTI calculations. TTI is calculated client-side by monitoring performance APIs and CPU active cycles. It works in all browsers too. User experience is not compromised since hydration will occur before the components are in view (with intersection observer) — otherwise, if the user is not looking at it, there’s no reason we can hydrate those areas of the application when the CPU is consistently idle.
The advantage of a TTI callback is that lighthouse will not measure code executed after TTI. While TTI itself isn’t heavily weighted anymore, it’s a very useful way to improve lighthouse and RUM metrics. So I use it to reduce the time of long-running functions like react hydration. Concurrent mode will likely improve the function execution time in the future.
Adaptive computation
Similar to TTI events, you can also get device capacity and network speed. Depending on what network or memory conditions are like, I can aggressively lazy hydrate or offload more vendor code. You can also adjust image quality and resolution.
Use faster loops and data transducers.
Native loop functions, like map, reduce,forEach, filter are terrible with bulk operations and don’t manage memory heap well.

The projects listed below are very good for faster iteration and data mutation. They generally outperform with larger datasets
Use memoization
Memoizing in react should be utilized more than often. Especially on components that have to perform heavy renders or have heavy Intense lifecycle hooks.
Reactive codebases have a bad habit of executing a lot of code during render cycles.
engineers also gravitate to the easiest place to put code, in the render method. We also map Over arrays in render methods quite often. Memoizing some older legacy code with heavy renders is a quick fix. Applying memoization in utility functions like URL parsers can also save time, especially if they are executed multiple times, yielding the same result
Use more sophisticated preloading
In combination with TTI callbacks. Lazy preloading links can be beneficial.
Take Advantage of Multi-Threading
Worker pools are not easy to configure in a seamless manner.
Using workerpool and Webpack 5’s Module Federation , we can use advanced architectural patterns with cutting edge tech in webpack 5.
Federated worker threads allow you to use the Host’s own remote as a way to hand off and work to another thread, its very seamless to do so with MF and this approach can work server or client-side (with a little change) Ill be writing about universal worker pools soon as I have the motivation to finish it.
Here's what the setup looks like:
- I'll need to configure ModuleFederationPlugin
plugins: [
 new **_webpack_**. **_container_**.ModuleFederationPlugin({
 name: "dashboard",
 filename: "static/runtime/remoteEntry.js",
 exposes: {
 "./utils": "./lighthouse/utils",
 },
 remotes: {
 dashboard:
 "dashboard@http://localhost:3000/\_next/static/runtime/remoteEntry.js",
 },
 }),
],
- Ill create a worker file, just for more efficient handoff (avoiding serialization of functions)
//worker.js
const federatedWorkerImport = async (containerPath, shareInit) =\> {
 const **_path_** = require("path");

**_global_**.\_\_webpack\_require\_\_ = require( **_path_**.join(
**_process_**.cwd(),
 ".next/server/webpack-runtime.js"
 ));
 const {
 initSharing: \_\_webpack\_init\_sharing\_\_,
 shareScopes: \_\_webpack\_share\_scopes\_\_,
 } = shareInit();
 // initialize any sharing, unlikely in a worker
 await \_\_webpack\_init\_sharing\_\_("default");
 // require container
 const container = require(containerPath).dashboard;
 // Initialize the container, it may provide shared modules
 await container.init(\_\_webpack\_share\_scopes\_\_.default);
 return (request) =\> {
 return container.get(request).then((factory) =\> factory());
 };
};

module.exports = federatedWorkerImport;
- I need to create a helper function to generate a worker
const createWorker = async (data, request, moduleExport) =\> {
 if (! **_process_**.browser) {
 const path = \_\_non\_webpack\_require\_\_("path");
 // could also make this an external, then just use "require"
 const initRemote = \_\_non\_webpack\_require\_\_(
 // needs webpack runtime to get \_\_webpack\_require\_\_
 // externally require the worker code with node.js This could be inline,
 // but i decided to move the bootstapping code somewhere else. Technically if this were not next.js
 // we should be able to import('dashboard/utils')
 // workers/index.js was in this file, but its cleaner to just move the boilerplate
 path.join( **_process_**.cwd(), "workers/index.js")
 );

 // essentially do what webpack is supposed to do in a proper environment.
 // attach the remote container, initialize share scopes.
 // The webpack parser does something similer when you require(app1/thing), so make a RemoteModule
 const federatedRequire = await initRemote(
 path.join( **_process_**.cwd(), ".next/server/static/runtime/remoteEntry.js"),
 () =\> ({
 initSharing: \_\_webpack\_init\_sharing\_\_,
 shareScopes: \_\_webpack\_share\_scopes\_\_,
 })
 );
 // the getter, but abstracted. This async gets the module via the low-level api.
 // The remote requires utils (basically this file lol) and i pull toFixed off its exports.
 // alternatively i could copy paste, but MF provides me the power to import the current file as an entrypoint
 const RemoteModule = await federatedRequire(request);
 return RemoteModule[moduleExport](data);
 }
};
- Now to create a function that hands-off data processing to a thread in the worker pool
const generateScatterChartData = async (data) =\> {
 if (! **_process_**.browser) {
 return pool
 .exec(createWorker, [data, "./utils", "generateScatterChartProcessor"])
 .then(function (result) {
 return result;
 })
 .catch(function (err) {
**_console_**.error(err);
 })
 .then(function (result) {
 return result;
 });
 }

 return {};
};
- And here we are, using this function in
getInitialProps
Report.getInitialProps = async ({ query }) =\> {
 const { meta, ...report } = await fetch(
 hostname + "api/get-report?report=" + query.report
 ).then((res) =\> res.json()); const [
 scatterChartData,
 whiskerChartData,
 multiSeriesChartData,
 ] = await **_Promise_**._all_([
 generateScatterChartData(report), //worker thread
 generateWhiskerChartData(report), //worker thread
 generateMultiSeriesChartData(report), //worker thread
 ]);
 return {
 scatterChartData,
 whiskerChartData,
 multiSeriesChartData,
 meta,
 appKeys: **_Object_**.keys(report),
 query,
 };
};
I used workerpool to create universal workers on both node and client.
Doing so gave me a 400% boost in-app performance and server response times
Other options, I have not tried — like parallel.js
I’m also experimenting on ways to grant access to the dom from inside Web workers, this could potentially reduce vendor impact if some of them are able to work inside a worker with a shimmed DOM API
Monitor performance at the module level.
This method is very useful for finding heavy modules that should be code split or pre-heated. You can then go back and retroactively work to improve the worst offending modules.
Great Vendors for Monitoring
While module level and user timings are helpful — it can be more effort to set up a Kibana dashboard to plot all this data. Especially RUM information.
Blue Triangle is one of my favorite vendors when it comes to performance. Some of the core features I love are:
- Realtime RUM data
- Reports on Core Web Vitals metrics
- You can run synthetic samples
- They can accurately calculate the missed revenue opportunity caused by poor performance
- Similar to Gate, Blue Triangle has the ability to calculate TTI on the client-side in RUM.
- Its got a great data science engine, I've used this to diagnose specific issues at specific internet exchange nodes.
- It's POWERFUL
- The staff are AMAZING to work with and are there to support their clients.
- The company takes user input seriously
RUM information helps see what impact your code is having on user devices. Thanks to blue triangle, I'm able to deploy experimental performance enhancements (inside a try-catch) into production. Then can look at the RUM data. Within 5 minutes I usually have my answer, they will either merge to master or re-deploy the master branch and continue working on my experiment till i see the impact I expect.
You are also able to send custom measurement timing back to BTT
There are some things I would like to see Blue Triangle improve on the product.
- Expose your RUM measurement functions as callback events.
Since BT already reports all this RUM data back to its servers. It would be AMAZING to have something likewindow.btt.events.isInteractive(myCallbackandwindow.btt.networkType // returns [3G,WIFI,LTE]not only would BT be able to measure RUM, but actually provide callbacks that help engineers improve. If you know the network speed/quality of a device, it would be amazing to hook into that information. I could build adaptive systems backed by RUM data - Report back the standard
performance.markuser timings API. Id like to be able to graph component level performance without using a custom marker.
Sentry is another critical vendor worth investing in.
You need to know if there are race conditions that were not picked up in standard regressions and QA. Error reporting and fast deploy pipelines let you move faster and rollback quickly.
Spending time exploring sentry APIs and available webhook options will be very valuable. I'm planning to use Sentry, Blue Triangle, and the still-in-beta Federation Dashboard to leverage Module Federation and command control systems that will be capable of automatically adapting how and what version of federated code gets attached to the host. I'll publish a separate article on what an architecture designed to be self-healing and self-regulating would look like. The good news is; a system like that is not too hard to make since I own the tooling to make it possible.
Graphana and Kibana
Fantastic tools for charting and consuming large amounts of data.
These have been my go-to at previous companies — having data is priceless. You can sell any initiative if you have data.
This article (a little old compared to module federation these days) goes into a little depth on what data i was plotting and how those graphana dashboards led us to outperform backend fragment caches
Using these dashboarding tools, you get a huge amount of data in high resolution. Especially on the frontend. I use a proxy to emit logs based on POST requests ill send to the endpoint. Graphing any and all frontend metrics is how you remain online and stable.
I good monitoring tactic is to attach events to business-critical flows. Like, add to cart. Graphing clicks and successful calls lets you create a moving average, then any metrics fall below the standard moving average — alerts are triggered and notifications are sent to slack.
I've relied on this to locate bad deploy issues. Graphana has also saved some serious revenue. I was able to react and respond to the famous east coast AWS outage before Amazon had updated their status. By the time the AWS status page showed East Coast outage. We had already moved production to our backup data center in Europe.
Consider lite hydration for quicker initial startup.
This method works by replacing ReactDOM with something lightweight. It can help with initial hydration times to get an app partially or fully interactive. You can also use a smaller dom library to handle only the initial hydration. Then re-hydrate with ReactDOM during idle time
Or try debounced render HOCs
This is a new trick I am experimenting with (right now)
My Link component is slow. Children change, props change. Each time I need to parse the URL and figure out if its an internal router link, or an external hyperlink.
While this isn't the most optimized solution, it was very effective under the conditions I'm trying it out against.
Parsing the URL takes about 1ms, the whole component takes a little around 1–2ms. Overall, this is how much time the component takes (for all links combined)
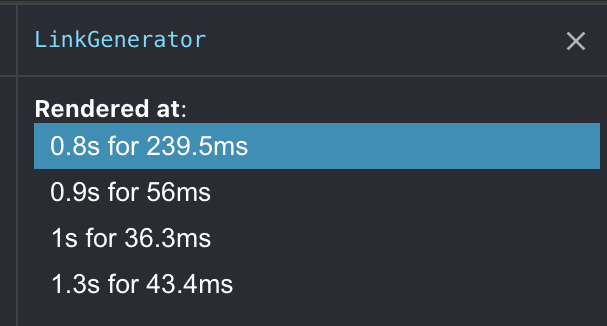
Around 50ms per render! Ouch!
Since this article pushed me to get universal workers up and running. I decided to see how much link would improve if I moved URL parsing to a workerpool I had been using lazy hydration to improve the time, but I needed to open PR to enable hydration without wrapper components.
I moved the URL parsing into a worker, then created a useEffect hook to update hyperlinks once there is a response from the workers, which let me process all links in parallel, off the main thread. which would save around 200ms.
const [match, setMatch] = React.useState({});
React.useEffect(() =\> {
 process.browser
 && requestIdleCallback(() =\> {
 pool
 .sendCommand('doesMatchRoute', [url, **_publicConfig_**])
 .then((data) =\> {
 setMatch(data);
 })
 .catch((err) =\> {});
 });
}, [url]);
const { routeMatch, relativeURL } = process.browser
 ? match
 : doesMatchRoute(url);
I don't want flicker to happen since I no longer have the props that were passed to its child markup. So rendering could flash if I return null till the worker is done. This is SSR so maintaining the initial markup is important. Till I move back to lazy hydration, ill just treat all links are <a>
Even when I removed the flicker — those workers had to re-compute the same URLs a few times, with nothing important actually changing that requires an immediate 50ms re-render. This got me thinking about debouncing the component's re-render cycle. If props change many times, let's debounce how quickly react will actually re-render.
export default (process.browser
 ? debounceRender(LinkGenerator, 0.1) : LinkGenerator
 : LinkGenerator);
This is a fairly gimmicky solution. But I cannot argue with the results of all this combined. With partial-hydration, I anticipate the initial render tick will improve, since I am still calling react.createElement
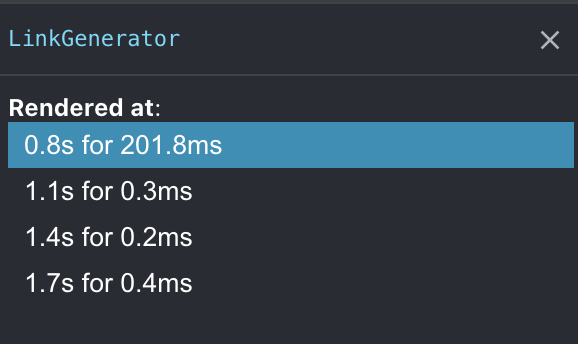
Hacky or not — that's impressive!
What the final result will look like.
I'll avoid debouncing. because I'm still paying for that first render.
The final solution will be with react-lazy-hydration but with additional modifications. I want to have the ability to hydrate on promise resolution.
This would let me leave markup totally ignored by React, till the worker responds with updates. A promise capability will also let me choose to hydrate react components based on TTI. I can use Gate, which is already monitoring chip performance and blocking vendor tags until there is less stress.
The worker pool needs to be consolidated into a hook or utility function, most importantly — I want these worker pools to use module federation (universally). My messages to a worker would act as a controller for MF within the worker. Since a remote container is only 5kb, the initial parse and startup time of the worker is significantly better. As i need more of my own codebase, the host messages the remote via a worker, tell it which module it should execute, and what arguments to execute with.
Utilize the GPU for data processing
The CPU is able to perform any computational task. But the GPU is faster at specific tasks — moving work to the GPU can result in much faster operations. But the GPU is not as versatile as a CPU, offloading random functions might not yield the expected result. So choose wisely and benchmark what should live in a worker and what should live in a GPU thread
DRY out code with better static analysis
Removing code is still the best performance tactic around. Don't look at the gzip size reduction, look at the uncompressed file size. You can remove 300kb of code — when gzip is applied it can end up being 5kb. But the browser still needs to uncompress and parse the full size. Just because it's small to transport doesn't mean it's just as easy to JIT parse, compile, and execute. Removing code is your best perf tactic 
That’s all for now!
This article is getting too long. I’ll write another one since there is plenty more to speak about.
Part 2 will be tweeted and added to this spot.
You know where to find me.
Twitter: ScriptedAlchemy
Github: ScriptedAlchemy