
The art of log merging: tools of the trade
Here I have this customer that asked for a design having unusually bright LEDs and an LDR to switch from day to night operation… and later added an opaque glass in front (that explains the unusually bright LEDs… but wait, things will get worse), and the whole assembly ended up leaking LED light into the LDR.
I knew there was leaking, that would explain the behavior this customer was observing, but since they claimed to have fixed it, I needed to prove it beyond a photograph. So, I quickly modified the board firmware to light the LEDs 4.5 seconds on, and then the same time off, and repeat, and jumped to do the measurements.
My lab has its limitations, the tools at hand were a set of asian-made logging luminometer and multimeter, plus what I could get out of the board. Furthermore, the light conditions barely let me see what I was doing, no way I could trustably see the measurements, take notes, and change light conditions at the same time. Welcome to the 21st century, our instruments now log their measurements and we will take advantage of that.
Things set up, I left the tools running and performed the changes to go from “night” to “day” and viceversa. I ended up with two beautiful logs; each instrument logged their measurements in two completely different spreadsheet-like formats. Yes, they were both the same brand. Yes, they were both sampling at the same frequency. No, they were not logging at the same frequency… there were repeated and missing timestamps in both logs. Of course, both logs started at different times, I have two hands and a forehead but only one mouse (No, both required a mouse click to start logging).
To make things worse, my locale is spanish (we are part of those people in the world that use the metric system and the comma to separate the decimal fraction from the integer part). One of the meters honored it and the other did not, so I had one log with commas and other with dots.
I am a gnuplot user and advocate, been using it for several decades now, but this seemed a bit hard for it; and particularly for myself using it. Enter vcdMaker and gtkWave.
vcdMaker can parse many logs, each one with its particular format, and merge them into a single variable change data format while keeping everything in sync. It does this by understanding time information based on how you teach it to get it. gtkWave can display that in a human understandable way like, let’s say, the graph for that wave… Since the hard part of the job is performed by vcdMaker, we’ll devote the rest of this “article” to celebrate how to get things done by taking advantage of this free (as in “free beer”) tool. (btw, gtkWave is free beer too)
The multimeter
Having set the microcontroller I/O to high-impedance, I measured the LDR resistance with my multimeter. This swiss-army knife has this usual oriental kindness and multipurpose universal problem solver sort of working, so the log is the same for all ways you can use it, and it is your problem to parse things… In this particular case, I’ve found it outputs something like this:
No Time DC/AC Value Unit AUTO 192 08:30:48 a.m. 206.7 k* AUTO 193 08:30:49 a.m. 203.0 k* AUTO 194 08:30:50 a.m. 198.5 k* AUTO 195 08:30:51 a.m. 426.5 k* AUTO 196 08:30:52 a.m. 0L. k* AUTO 197 08:30:53 a.m. 0.766 M* AUTO 198 08:30:54 a.m. 0.915 M* AUTO 199 08:30:55 a.m. 0.276 M* AUTO 200 08:30:55 a.m. 243.2 k* AUTO 201 08:30:56 a.m. 227.7 k* AUTO 202 08:30:57 a.m. 217.5 k* AUTO 203 08:30:58 a.m. 541.4 k* AUTO 204 08:30:59 a.m. 0L. k* AUTO

205 08:30:59 a.m. 1.981 M\* AUTO
A nice tab separated log with a human readable time stamp, and the quite useful range changes and overflow indication, in human readable form. That is exactly what you don’t want when you need machine parseable stuff… However, vcdMaker can parse this. A quick request to the author informed me that it can parse several indications to the same signal (and later I discovered sort of the opposite is also true), so handling Kohms and Mohms indications was a breeze.
I’m nil at regular expressions, and the vcdMaker config file is an XML that uses these for indications. So, don’t criticize me for being q&d, but this is what I came up with:
<?xml version="1.0" encoding="UTF-8" standalone="no" ?> <!DOCTYPE signals SYSTEM "vcdMaker.dtd"> <signals> <real> <line>([[:digit:]]+)\t([[:digit:]]+):([[:digit:]]+):([[:digit:]]+) a.m.\t\t([[:digit:][:punct:]]+)\tk*\tAUTO</line>

\<timestamp\>3600_\*_dec(2) + 60\*dec(3) + dec(4)\</timestamp\>

 <name>"Top.R"</name> <value>flt(5)</value> </real> <real> <line>([[:digit:]]+)\t([[:digit:]]+):([[:digit:]]+):([[:digit:]]+) a.m.\t\t([[:digit:][:punct:]]+)\tM*\tAUTO</line> <timestamp>3600*dec(2) + 60*vcddec(3) + dec(4)</timestamp> <name>"Top.R"</name> <value>flt(5) * 1000</value> </real>

\</signals \>
This takes care of parsing the two record types I’m interested in: the one reporting Kohm values and the one reporting Mohm values. As you can see, it is just a matter of catching fields and reference them later. The timestamp tag converts human readable times to seconds. (I’m busy enough to let the pm lines for later…)
Notice how both real entries reference the same variable name, so they merge into a single set of values. In case there are two records with the same timestamp, the most recent one takes precedence (replaces the older one).
The luminometer
This one is a bit more recent, so it made things worse… as it honored my locale. vcdMaker can handle dots or commas, but it will pass them as they are. In order to correctly merge both logs, one of them must be converted. Nothing that sed couldn’t do in a breeze:
sed -e 's/,/./g' < filewithcommas > filewithdots
The log format is something like this:
No Time Value Unit
1 08:27:45 12,85 lux
2 08:27:46 12,68 lux
3 08:27:47 12,59 lux

4 08:27:48 12,59 lux
Quite more machine-friendly, but still bothersome. I came up with this config file:
<?xml version="1.0" encoding="UTF-8" standalone="no" ?> <!DOCTYPE signals SYSTEM "vcdMaker.dtd"> <signals> <real> <line>([[:d:]]+)\t([[:d:]]+):([[:d:]]+):([[:d:]]+)\t([[:digit:][:punct:]]+)\t([[:graph:]]+)</line> <timestamp>3600*dec(2) + 60*dec(3) + dec(4)</timestamp> <name>"Top.Light"</name> <value>flt(5)</value> </real>

\</signals \>
The merge action
Now we can either process both logs and see the signals (it is a good idea to try this first to check possible errors in the config file), by running vcdMaker with the -v option to be verbose. Or we can just go for it.
To merge both logs into one vcd file, while also checking we are on the right track:
vcdMerge -v -o ldr_r.vcd U{ldr_r.xml},0,s,,,Hal/download/R.csv U{ldr_lumi.xml},0,s,,,Hal/download/lumi.csv
Once we know what we are doing, we can remove the -v. But, wait! Where did all those names and numbers come from ?
- -o ldr_r.vcd: the name of the output file, the one that will be the merged log, and we will open later with gtkWave.
- U{ldr_r.xml},0,s,,,Hal/download/R.csv: the first log and all its parameters
- U{ldr_r.xml}: the config file for this log
- 0: the time offset to sync with the other log(s)
- s: the time unit we are using, seconds
- Hal/download/R.csv: the name of the file for this log
- U{ldr_lumi.xml},0,s,,,Hal/download/lumi.csv
- yes, you can understand this one
Since both logs have a timestamp in “seconds since midnight” format, we can sync them at 0. Otherwise, we have to find that point in both logs and provide it here (what we will do in a followup ?). Caveat emptor: don’t work beyond midnight or you will have an overflow.
Those extra commas hide two useful parameters we don’t need right now. You can always go to the tool webpage and read the docs, don’t you ?
The analysis
Now open gtkWave, open a new tab if necessary, load your vcd file, click on Top, append your signals, and…
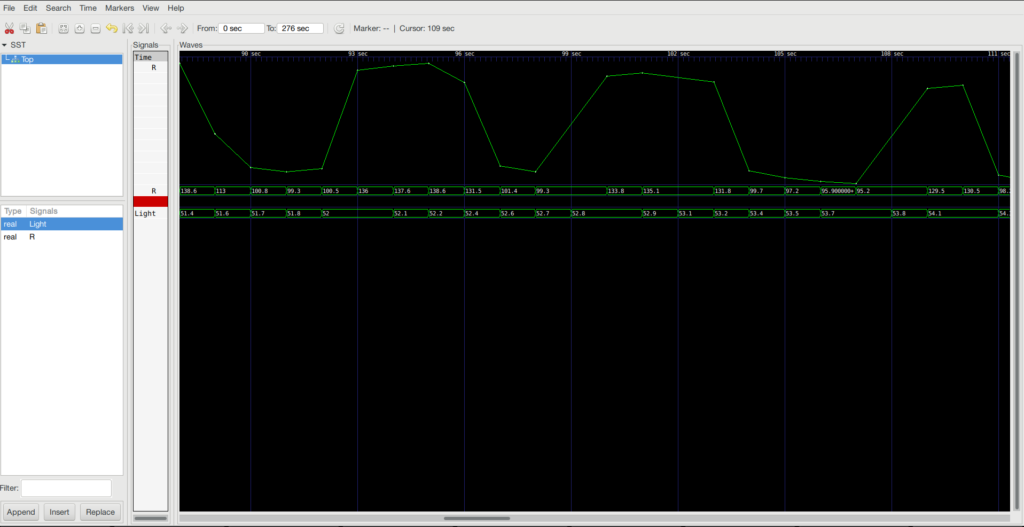
Bingo! The resistance values change in accordance with the lighting of the LEDs… Proven.
To see the waveform, I added R two times, and in one of them, at the Signals, column, left-click selected Data format -> Analog -> Interpolated Annotated. Then, a series of left-click inserted Insert Analog Height Extension provides the necessary “zooming”.
As you can see, all signals are correctly time aligned while their values (or graph) are shown.
Behind the lines
I intentionally left some details out. vcdMaker generates vcd formatted files. That is normally used in the digital design world, so the words used in the documentation might be confusing if one does not understand a bit of that world. The same will happen with gtkWave.
Things can get a bit tougher, and that will be addressed in a followup.