
Hitchhiker's guide to Exploratory Data Analysis
How to investigate a dataset with python?
- “How do I get a kickstart in the field of Data Science/Machine learning/Data Analysis?”
- “What should be my initial steps towards making a connection with the dataset when you have it?”
- “How to define a set of questions looking at a dataset during exploratory analysis?”
If you’re looking for an answer to any of the above questions, then this blog series should really help you get started.
So, what is Exploratory Data Analysis (EDA)?
Exploratory data analysis (EDA) is a crucial component of data science which allows you to develop the gist of what your data look like and what kinds of questions might be answered by them.
Ultimately, EDA is important because it allows the investigator to make critical decisions about what is interesting to pursue and what probably isn’t worth following up on and thus building a hypothesis using the relationships between variables.
A bit of context
This is a two part series where we are going to look into a Movie dataset from Kaggle and we’ll do some exploratory analysis to investigate the data.
We’ll be using python in this tutorial. I suggest that you brush up your python basics before reading ahead. I’m going to walk you through the steps I took to perform EDA on a dataset.
The TMDB movies dataset can be found here. There are different ways of collecting data which we’ll talk about in another post. As a Data Analyst, my job is to be able to pose a set of questions, read between the lines and find answers to those questions.
I’ve broken this down into 3 parts:-
- Cleansing: Checking for problems with the collected data, such as missing data or measurement error, data type of columns, etc.)
- Defining questions : Identifying relationships between variables that are particularly interesting or unexpected.
- Using effective visualizations to communicate my results(to be covered in the 2nd part.
I’ve used jupyter notebooks as I find them the best for data cleansing, transformation, numerical simulation, data visualization. An added advantage of Jupyter Notebook is that you can take that very same Jupyter Notebook you used to model and visualize a dataset, and use it as a slideshow for a technical presentation.
The code for this post can be found on my Github:
The first step is to create a virtual environment in which you will install all your packages. Below is the command which will install 4 packages for us using pip.
pip install numpy pandas seaborn matplotlib
- Numpy: A fundamental package for scientific computing with Python.
- Pandas: A library providing high-performance, easy-to-use data structures and data analysis tools for the Python programming language.
- Matplotlib: A Python 2D plotting library which produces publication quality figures in a variety of hardcopy formats and interactive environments across platforms.
- Seaborn: A Python data visualization library based on matplotlib. It provides a high-level interface for drawing attractive and informative statistical graphics.
Import the python packages which you would need to clean, crunch and visualize. I’ve imported the packages and the second part (as pd ) is just for convenience so that I don’t have to write “ pandas.command” every time I use it.
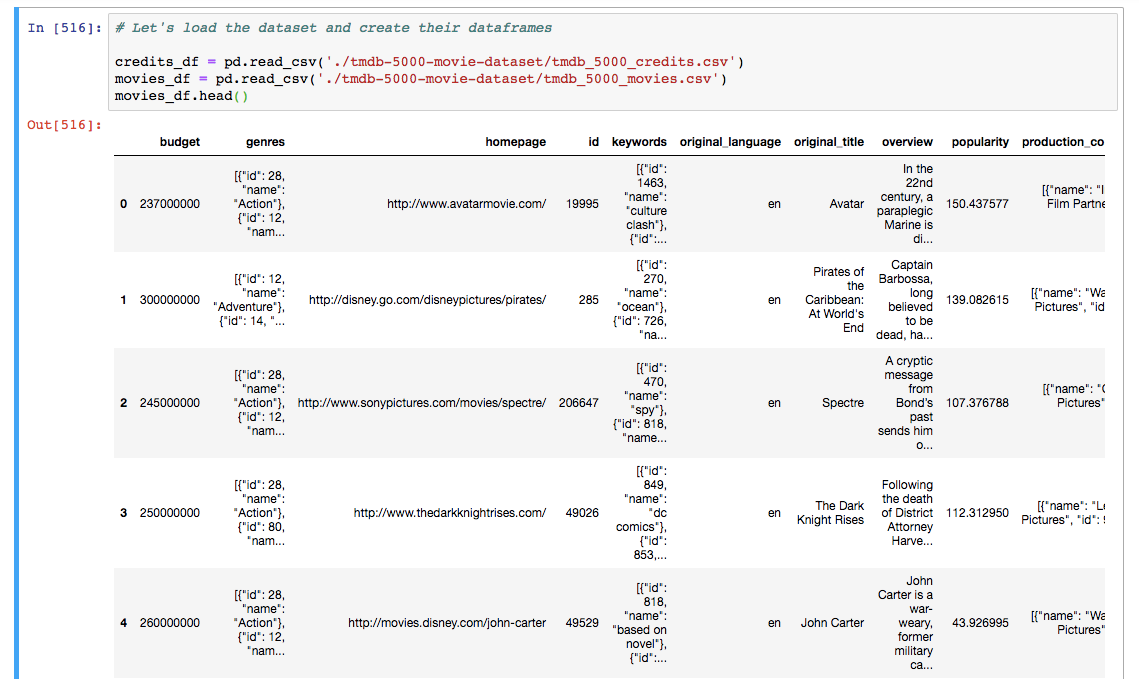
Loading the data from the path:
Here, I’ve used pandas’ read_csv function which returns a fast and efficient DataFrame object for data manipulation with integrated indexing. I’ve two dataframes from movies_df and credits_df.
movies_df.head() is going to display the first 5 rows of the dataframe. You can pass the number of rows you want to see to the head method. Take a look at the dataframe we’ve got:
Before we start looking for the hidden answers in this data, we’ll have to clean the data to prepare it for analysis.
#1 Data Cleansing Process
Data cleansing is the first and a very crucial step in the overall data preparation process and is the process of analysing, identifying and correcting messy, raw data. When analysing organisational data to make strategic decisions you must start with a thorough data cleansing process.
-
We need to remove unused columns such as id, imdb_id, vote_count, production_company, keywords, homepage etc. It is always easier to make your decisions from the data which is actually relevant and concise.
Here is how you can drop the redundant columns from the dataframe: -
Removing the duplicacy in the rows (if any):
-
Some movies in the database have zero budget or zero revenue which implies that their values have not been recorded or some information is missing. We will be discarding such entries from the dataframe:
-
To manipulate the columns easily, it is important that we make use of the python objects. Changing release date column into Date format and extracting the year from the date which will help us in analysing yearly data.
-
Similarly, changing budget and revenue columns format to integer using numpy’s int64 method.
-
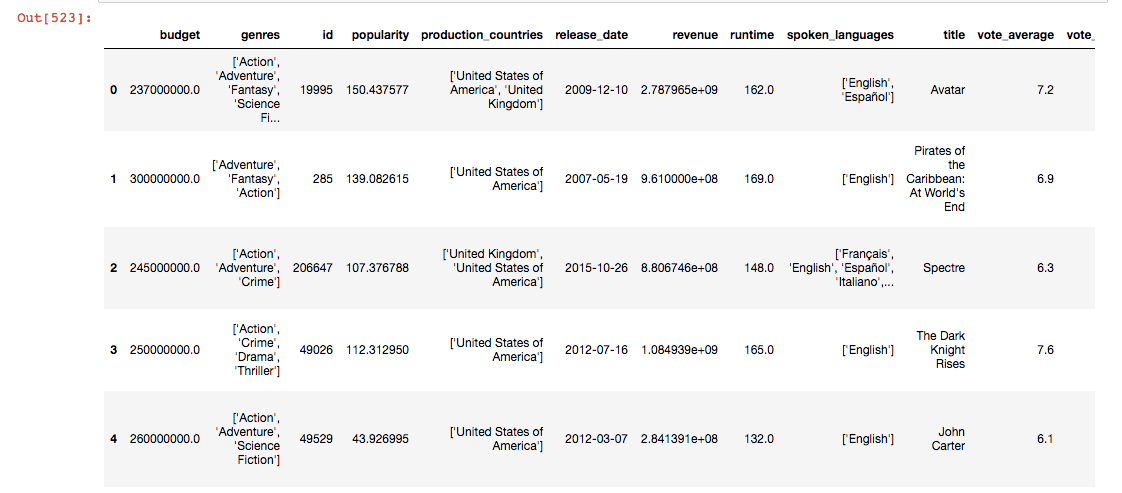
On checking the dataset, we see that genres, keywords, production_companies, production_countries, spoken_languages are in the JSON format which will make it while manipulating the dataframe. Now let’s flatten these columns into a format that can be easily interpreted.
We will convert them into strings and later convert them into lists. Writing a generic function to parse JSON columns.
After cleansing, this is what the data looks like:
#2 Identifying relationships between variables / features
The main goal here is to identify and create relationships which can help you to build a hypothesis. We’ll have to define questions which can help us build some relationships to look at.
At this point, I came up with the following questions when I studied this dataset. You may come up with a different set of questions which are not listed below:
-
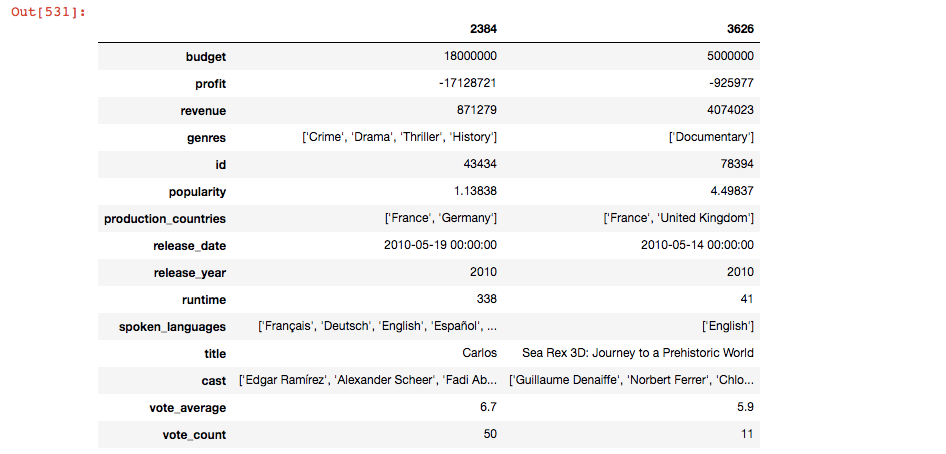
Which are the 5 most expensive movies? Comparison between the extremes? Exploring the most expensive movies, it can tell you if they were even worth the money spent on them based on their performance and revenue generated.
-
Since we need to compare the minimums and maximums in 3 questions, we can write a generic function to do that for us and reuse that.
-
Top 5 most profitable movies? Comparison between the min and max profits. The comparison helps us in identifying the different approaches which failed and succeeded. If I subtract the budget from the revenue generated, it will give me the profit earned.
-
Most talked about Movies.
-
Average runtime of movies? Comparison between the extremes.
-
Movies which are rated above 7
-
Which year did we have the most profitable movies?
This will help you raise some deeper questions about the years when movies didn’t do well or when they did. These are preliminary questions which give rise to questions providing deeper insights.
Let’s take a look at the spread of profitable movies over the years
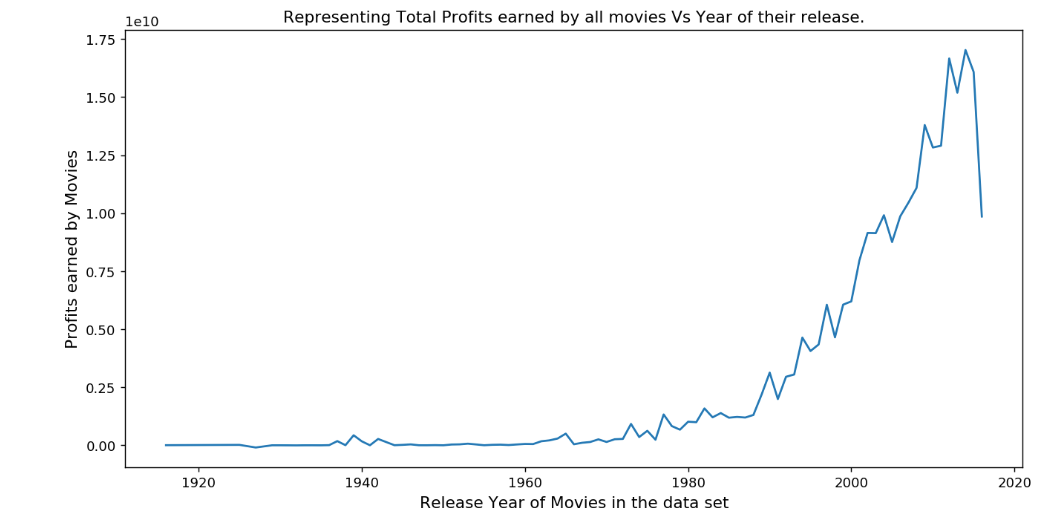
To find the year in which we had the most number of profitable movies, we used idxmax method :
This would give us 2014. You can look at all the output of these code snippets in the Ipython notebook here.
Now that we’ve analysed at what this dataset contains, it’s time that we try to build a story which can predict the success rate of a movie based on the features / variables chosen. Hence, we need to determine the factors which make a movie e frequency of movies in each genre.
2. Frequent Cast in movies — plot showing the spectrum of movies for each actor.
3. Average budget of the profitable movies — what is the average budget allocated
4. Average duration of the most profitable movies.
5. Language of the most profitable movies.
Answers to all the questions above would help us build our hypothesis which is “What is the recipe to make a blockbuster, profitable movie?”
In the next post, I am going to discuss about how can we make use of Matplotlib and seaborn libraries to visualize(#3 in this process) the answers of above questions.
We’ll conclude the investigation in the next part(link below) with all the findings and visualisations.