
Efficient classification statistics in PostgreSQL using function indexes
Today's customers have come to expect live, real time statistics to be available for many metrics of their systems, and with RDBMS-based systems it frequently falls to the use of aggregate functions in queries that turn out to be slow and expensive.
Many optimisations can be applied to make pre-prepared statistics available to avoid running aggregate queries over large datasets in real-time.
- An application layer may maintain statisics outside the transaction. This can be very effective if eventual consistency is acceptable. It also permits statistcs to be sent to a different database, which may be more appropriate in some cases. It does however present a maintenance burden, particularly if multiple applications will access the database.
- Triggers may maintain statistics within the transaction. This guarantees consistency and integrity and is easy to maintain. However it is not unusual to find performance and deadlock issues arising from this.
- Materialized views may maintain statistics. This is really not real-time but does support very complex statistics that would be difficult to maintain incrementally.
- Expensive proprietary data warehousing solutions may be suitable if you can afford it.
Before rushing to implement any of the above, it is worth considering an oft-overlooked technique that is available to users of advanced RDBMSs such as PostgreSQL and Oracle. For statistics that can be mapped to a count of tuples qualified by a classifier function, we can leverage function based indexes to have the system in effect precalculate and cache the class of each tuple in a btree index where the count can be retreived by a matching query.
Let's consider an example as follows. Suppose we have data from a survey of respondents noting their age and rating their perference for personal and economic freedom on two axes. We will develop an efficient statistic for classifying them according to the Nolan chart as follows:
First we create a relation for respondents that will hold an pseudonomous identifier, their age and two axes with their overall survey scores for questions relating to their political priorities along these two axes. The personal field represents the personal freedom metric on a scale of 0 to 10. The economimc field represents the economic freedom metric, also on a scale of 0 to 10. The resulting create table query is as follows:
create table respondent (
  id integer primary key,
  age integer not null,
  personal integer not null,
  economic integer not null
);
Let's populate our table with some random data. We do this with an insert into ... select construct that takes bunch of rows generated by an query and inserts them into the table you specify. We use the generate_series which returns a set of rows and ask it for 1 million consecutive integers that we will use to populate our id column. The random month gives us some fairly unrealistically uniform values for age, economic and personal metrics. You might want to get a cup of tea whilst this runs.
insert into respondent
select id, round(random() * 82 + 18), round(random() * 10), round(random() * 10)
  from generate_series(1,10000000,1) as id;
Now we define a function for classifying a respondent's political position according to the Nolan system. We use an inline view as syntatic sugar to rename the economic and personal metrics to x and y points on the Nolan chart and a simple case expression to divide up the metric space into the classifications for our Nolan-chart inspired statistics. Note that it is important to specify the function is immutable in order to make it suitable for indexing.
create or replace function political_position(personal integer, economic integer) returns text as $BODY$
  select case
    when x + y > 11 and x > 5 and y > 5 then 'libertarian'
    when x - y < -1 and x < 5 and y > 5 then 'left-liberal'
    when x + y < 9  and x < 5 and y < 5 then 'authoritarian'
    when x - y > 1  and x > 5 and y < 5 then 'conservative'
    else 'centrist'
  end from (select economic x, personal y) x
$BODY$ language sql immutable returns null on null input cost 10;
Now for convenience, we create a view that decorates the table with this function. This is like adding a virtual field to the table and means we can reference these virtual fields in both output fields and group by fields in a manner that is both concise and less error-prone that repeating the same subexpression.
create view v_respondent as
  select *, political_position(personal, economic) as political_position
  from respondent;
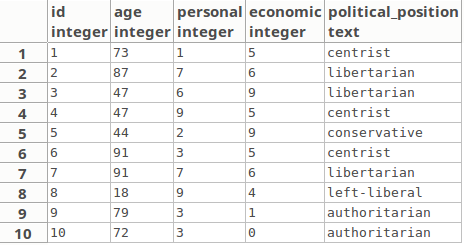
We can query this view to get a sample of this dataset then looks as follows:
select * from v_respondent limit 10
Here is a example of the sample you would expect to see here:
Now we can see how postgres goes about obtaining a count of respondents in each class by bringing up the explain plan of a query for the count of respondents:
explain
select political_position, count(*)
from v_respondent where age between 18 and 25
group by political_position;
What this explain plain shows is that a sequential scan of the table is required in order to calculate this statistic:
HashAggregate  (cost=180557.22..181557.38 rows=28576 width=40)
  Group Key: political_position(respondent.personal, respondent.economic)
  ->  Seq Scan on respondent  (cost=0.00..180307.21 rows=50001 width=32)
        Filter: (age = 18)
However, we can use a function index to optimize this:
create index on respondent(age, political_position(personal, economic));
The resulting explain plan shows us that the query is satisfied use an index-only query using the index we have provided:
GroupAggregate  (cost=62259.01..64470.16 rows=48890 width=44)
  Group Key: respondent.age, (political_position(respondent.personal, respondent.economic))
  ->  Sort  (cost=62259.01..62384.01 rows=50000 width=36)
        Sort Key: (political_position(respondent.personal, respondent.economic))
        ->  Bitmap Heap Scan on respondent  (cost=1296.06..58356.60 rows=50000 width=36)
              Recheck Cond: (age = 18)
              ->  Bitmap Index Scan on respondent_age_political_position_idx  (cost=0.00..1283.56 rows=50000 width=0)
                    Index Cond: (age = 18)
The use of function indexes is made easy by the simple trick of defining a view with fields that exactly match the function indexes you have defined on it.
One caveat to bear in mind is that PostgreSQL needs to scan for modified pages even when using a function index, so if the underlying table is subject to a heavy load of updates then the function index technique will not perform so well. This can be seen in the cost annotation in the explain plan, which gives us such a worst-case estimate of the cost.