
Apache Beam: a Python example
Nowadays, being able to handle huge amounts of data can be an interesting skill: analytics, user profiling, statistics — virtually any business that needs to extrapolate information from whatever data is, in one way or another, using some big data tools or platforms.
One of the most interesting tool is Apache Beam, a framework that gives us the instruments to generate procedures to transform, process, aggregate, and manipulate data for our needs.
Let’s try and see how we can use it in a very simple scenario.
The context
Imagine that we have a database with information about users visiting a website, with each record containing:
- country of the visiting user
- duration of the visit
- user name
We want to create some reports containing:
- for each country, the number of users visiting the website
- for each country, the average visit time
We will use Apache Beam, a Google SDK (previously called Dataflow) representing a programming model aimed at simplifying the mechanism of large-scale data processing.
It’s been donated to the Apache Foundation, and called Beam because it’s able to process data in whatever form you need: batches and streams (b-eam). It gives you the chance to define pipelines to process real-time data (streams ) and historical data (batches ).
The pipeline definition is totally disjointed by the context that you will use to run it, so Beam gives you the chance to choose one of the supported runners you can use:
- Beam model: local execution of your pipeline
- Google Cloud Dataflow: dataflow as a service
- Apache Flink
- Apache Spark
- Apache Gearpump
- Apache Hadoop MapReduce
- JStorm
- IBM Streams
We will be running the beam model one, which basically executes everything on your local machine.
The programming model
Though this is not going to be a deep explanation of the DataFlow programming model, it’s necessary to understand what a pipeline is: a set of manipulations being made on an input data set that provides a new set of data. More precisely, a pipeline is made of transforms applied to collections.
Straight from the Apache Beam website:
A pipeline encapsulates your entire data processing task, from start to finish. This includes reading input data, transforming that data, and writing output data.
The pipeline gets data injected from the outside and represents it as collections (formally named PCollection s ), each of them being
a potentially distributed, multi-element, data set
When one or more Transform s are applied to a PCollection, a brand new PCollection is generated (and for this reason the resulting PCollection s are immutable objects).
The first and last step of a pipeline are, of course, the ones that can read and write data to and from several kind of storages — you can find a list here.
The application
We will have the data in a csv file, so the first thing we need to do is to read the contents of the file and provide a structured representation of all of the rows.
A generic row of the csv file will be like the following:
United States Of America, 0.5, John Doe
with the columns being the country, the visit time in seconds, and the user name, respectively.
Given the data we want to provide, let’s see what our pipeline will be doing and how.
Read the input data set
The first step will be to read the input file.
with apache_beam.Pipeline(options=options) as p:

    rows = (
        p |
        ReadFromText(input_filename) |
        apache_beam.ParDo(Split())
    )
In the above context, p is an instance of apache_beam.Pipeline and the first thing that we do is to apply a built-in transform, apache_beam.io.textio.ReadFromText that will load the contents of the file into a PCollection. After this, we apply a specific logic, Split, to process every row in the input file and provide a more convenient representation (a dictionary, specifically).
Here’s the Split function:
class Split(apache_beam.DoFn):

    def process(self, element):
        country, duration, user = element.split(",")

        return [{
            'country': country,
            'duration': float(duration),
            'user': user
        }]
The ParDo transform is a core one, and, as per official Apache Beam documentation:
ParDo is useful for a variety of common data processing operations, including:
- Filtering a data set. You can use
ParDoto consider each element in aPCollectionand either output that element to a new collection or discard it. - Formatting or type-converting each element in a data set. If your input
PCollectioncontains elements that are of a different type or format than you want, you can useParDoto perform a conversion on each element and output the result to a newPCollection. - Extracting parts of each element in a data set. If you have a
PCollectionof records with multiple fields, for example, you can use aParDoto parse out just the fields you want to consider into a newPCollection. - Performing computations on each element in a data set. You can use
ParDoto perform simple or complex computations on every element, or certain elements, of aPCollectionand output the results as a newPCollection.
Please read more of this here.
Grouping relevant information under proper keys
At this point, we have a list of valid rows, but we need to reorganize the information under keys that are the countries referenced by such rows. For example, if we have three rows like the following:
Spain (ES), 2.2, John Doe> Spain (ES), 2.9, John Wayne> United Kingdom (UK), 4.2, Frank Sinatra
we need to rearrange the information like this:
{
    "Spain (ES)": [2.2, 2.9],
    "United kingdom (UK)": [4.2]
}
If we do this, we have all the information in good shape to make all the calculations we need.
Here we go:
timings = (
    rows |
    apache_beam.ParDo(CollectTimings()) |
    "Grouping timings" >> apache_beam.GroupByKey() |
    "Calculating average" >> apache_beam.CombineValues(
        apache_beam.combiners.MeanCombineFn()
    )
)

users = (
    rows |
    apache_beam.ParDo(CollectUsers()) |
    "Grouping users" >> apache_beam.GroupByKey() |
    "Counting users" >> apache_beam.CombineValues(
        apache_beam.combiners.CountCombineFn()
    )
)
The classes CollectTimings and CollectUsers basically filter the rows that are of interest for our goal. They also rearrange each of them in the right form, that is something like:
(“Spain (ES)”, 2.2)
At this point, we are able to use the GroupByKey transform, that will create a single record that, incredibly, groups all of the info that shares the same keys:
(“Spain (ES)”, (2.2, 2.9))
Note: the key is always the first element of the tuple.
The very last missing bit of the logic to apply is the one that has to process the values associated to each key. The built-in transform is apache_beam.CombineValues, which is pretty much self explanatory.
The logics that are applied are apache_beam.combiners.MeanCombineFn and apache_beam.combiners.CountCombineFn respectively: the former calculates the arithmetic mean, the latter counts the element of a set.
For the sake of completeness, here is the definition of the two classes CollectTimings and CollectUsers:
class CollectTimings(apache_beam.DoFn):

    def process(self, element):
        """
        Returns a list of tuples containing country and duration
        """

        result = [
            (element['country'], element['duration'])
        ]
        return result


class CollectUsers(apache_beam.DoFn):

    def process(self, element):
        """
        Returns a list of tuples containing country and user name
        """
        result = [
            (element['country'], element['user'])
        ]
        return result
Note: the operation of applying multiple times some transforms to a given PCollection generates multiple brand new collections. This is called collection branching. It’s very well represented here:
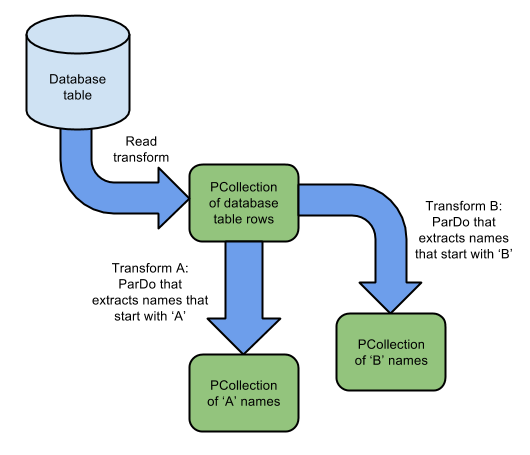
Source: https://beam.apache.org/images/design-your-pipeline-multiple-pcollections.png
Basically, now we have two sets of information — the average visit time for each country and the number of users for each country. What we're missing is a single structure containing all of the information we want.
Also, having made a pipeline branching, we need to recompose the data. We can do this by using CoGroupByKey, which is nothing less than a join made on two or more collections that have the same keys.
The last two transforms are ones that format the info into csv entries while the other writes them to a file.
After this, the resulting output.txt file will contain rows like this one:
Italy (IT),36,2.23611111111
meaning that 36 people visited the website from Italy, spending, on average, 2.23 seconds on the website.
The input data
The data used for this simulation has been procedurally generated: 10,000 rows, with a maximum of 200 different users, spending between 1 and 5 seconds on the website. This was needed to have a rough estimate on the resulting values we obtained. A new article about pipeline testing will probably follow.
GitHub repository
The GitHub repository for this article is here.
The README.md file contains everything needed to try it locally.!