
Top 5 Best Open Source Javascript Chart Library

In this post, we will talk about top 5 best open source javascript chart library. Every site and dashboard are incomplete without charts and graphs so it is very important to find the right chart library for our application. Following libraries will help you to create customizable and beautiful charts for your application.
D3.js — Data-Driven Documents

D3.js is an open source Javascript library used for manipulating documents based on the user data. It is a powerful tool which gives life to the data with the help of HTML, SVG, and CSS. D3 allows developers to bind arbitrary data to a DOM and then it applies the data-driven transformation to the DOM.
For Example: Consider an array of numbers, You can use it to generate HTML table or you can use the same data to generate interactive bar or pie charts.
official website: https://d3js.org/
Google Charts
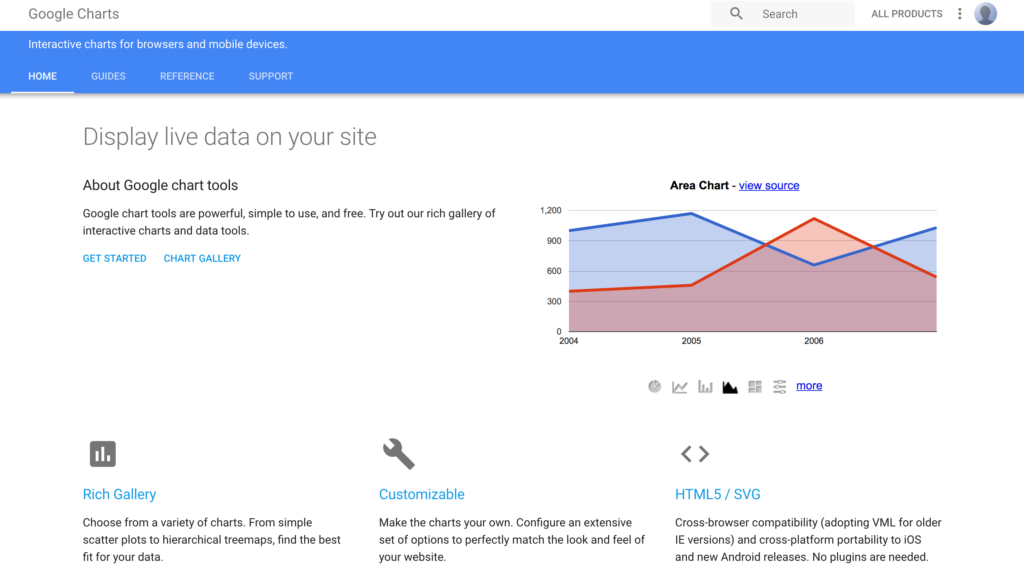
Google Charts is an open source chart library and which is more powerful and very simple to use. It has many interactive charts to display and render the live data. It has rich chart gallery like the pie chart, bar chart, Scatter Charts, donut charts and etc. Moreover various customization option available with the charts.
It also got charts like Histograms, timelines, trend lines, Sankey Diagram, and etc.
official website: https://google-developers.appspot.com/chart/
Chart.js
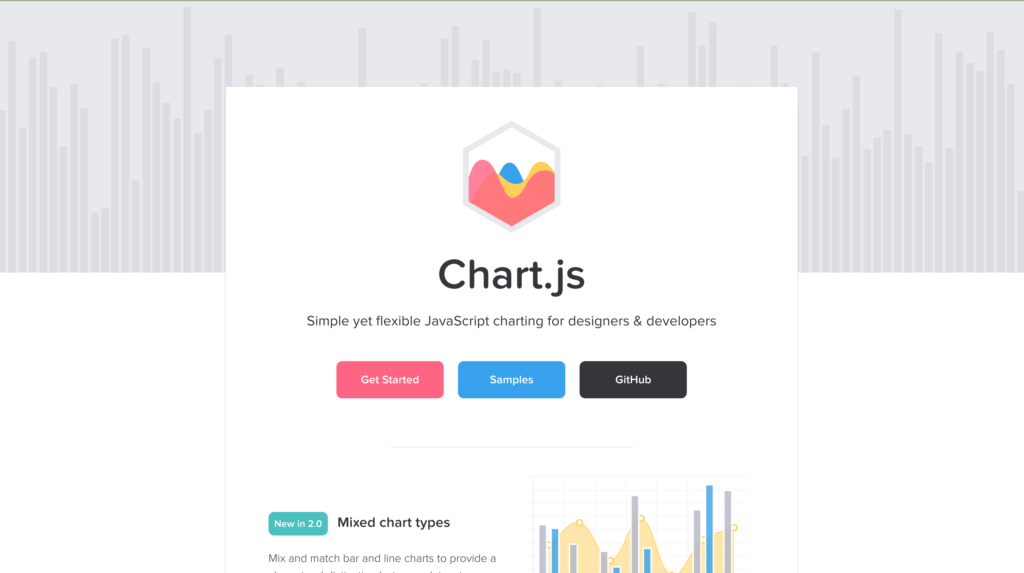
Chart.js is a community maintained chart library and using it we can create responsive charts for your website. Using it we can generate Mixed charts and it has great rendering capacity in modern browsers. It has very good documentation and samples available.
Angular Chart is built on top of Chart.js library and for angular projects, we can use Angular charts and it will be really easy to implement.
official website: http://www.chartjs.org/
Chartist.js

Chartist.js is also an open source javascript library something similar to Chart.js and it got rich and response charts available. Using it we can generate SVG charts and DPI independent. It has support for most of the modern browsers and good community support. It has support for some other technologies like node, angular. java, WordPress, ember, react, AngularJs and Meteor.
Official website: http://gionkunz.github.io/chartist-js/
n3-charts
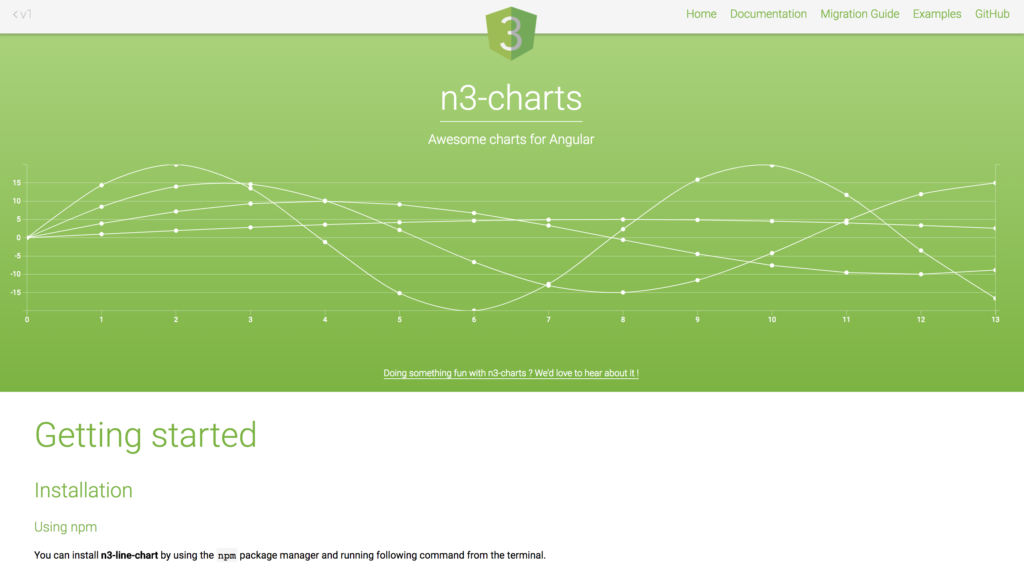
n3-charts is also an open source javascript chart library and it makes the life of the angular developer easy. n3-charts is built on top of D3.js and angularJs hence it posses more powerful charts and easy to implement.
official website: http://n3-charts.github.io/line-chart/#/home
Check article on Equality Operators.
Originally published at nodesimplified.com on December 16, 2017.