
amCharts Tutorial: Integrating into Angular 2
This tutorial is based on the Codementor Office Hours with Anton Selin who shared his knowledge about integrating and using amCharts library with Angular 2 framework. Anton is a senior developer with extensive experience in web development and enterprise architecture.
amCharts API’s functionalities enable us to pass parameters and set up it’s internals through the chart’s rendering engine. And in a way, amCharts is kind of like a black box that gives us flexibility in terms of set up (though we cannot directly access the way it renders the chart). The amCharts website provides more detailed information about the technology.
But before we start with this amCharts tutorial, let’s first establish the setup environment.
Prerequisites
First of all, we need a sample app so we can have an environment to implement AmCharts library into. For that purpose, feel free to download the Angular 2 app from the official ng website, and is also available on GitHub.
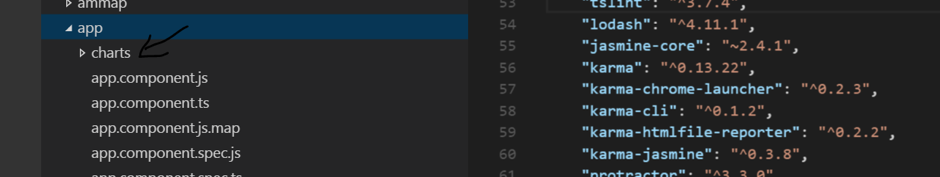
After downloading the application, we need to run the npm install command, which will pull all packages needed for our app. This packages are described in the package.json file in the root of our app. Since ng2 is still in development, the versions of packages may change, so make sure that our package.json file have the following dependencies with the corresponding package version:
"dependencies": {
    "@angular/common": "2.0.0-rc.4",
    "@angular/compiler": "2.0.0-rc.4",
    "@angular/core": "2.0.0-rc.4",
    "@angular/forms": "0.2.0",
    "@angular/http": "2.0.0-rc.4",
    "@angular/platform-browser": "2.0.0-rc.4",
    "@angular/platform-browser-dynamic": "2.0.0-rc.4",
    "@angular/router": "3.0.0-beta.2",
    "@angular/router-deprecated": "2.0.0-rc.2",
    "@angular/upgrade": "2.0.0-rc.4",

    "systemjs": "0.19.27",
    "core-js": "^2.4.0",
    "reflect-metadata": "^0.1.3",
    "rxjs": "5.0.0-beta.6",
    "zone.js": "^0.6.12",

    "angular2-in-memory-web-api": "0.0.14",
    "bootstrap": "^3.3.6"
  },
  "devDependencies": {
    "concurrently": "^2.2.0",
    "lite-server": "^2.2.0",
    "typescript": "^1.8.10",
    "typings": "^1.0.4",

    "canonical-path": "0.0.2",
    "http-server": "^0.9.0",
    "tslint": "^3.7.4",
    "lodash": "^4.11.1",
    "jasmine-core": "~2.4.1",
    "karma": "^0.13.22",
    "karma-chrome-launcher": "^0.2.3",
    "karma-cli": "^0.1.2",
    "karma-htmlfile-reporter": "^0.2.2",
    "karma-jasmine": "^0.3.8",
    "protractor": "^3.3.0",
    "rimraf": "^2.5.2"
  },
Now open the cmd and run the npm install command (make sure you are in the root folder of the app).
After that, let’s run npm start command to start the lite server. This will monitor the changes in the typescript files.
If everything is installed correctly, you should see the sample app running in your browser:

Now let’s create a folder named charts in the app folder:
Since our app is empty, we need to implement some buttons in the app component template. Then we will implement the following functionality: when the user clicks on the button it will invoke the component containing chart and render it in the router-outlet (you can find more info about router-outlet here.
amCharts Tutorial: Implementation steps
Getting started with amCharts
Once we have established our setup environment, now you need to download the charting library in the download page. Once you get to the page, choose JavaScript Charts. You should have downloaded a zip file that has some samples in the samples folder. For this amCharts tutorial, choose BarCustered.html and run it in the browser, this chart should appear:
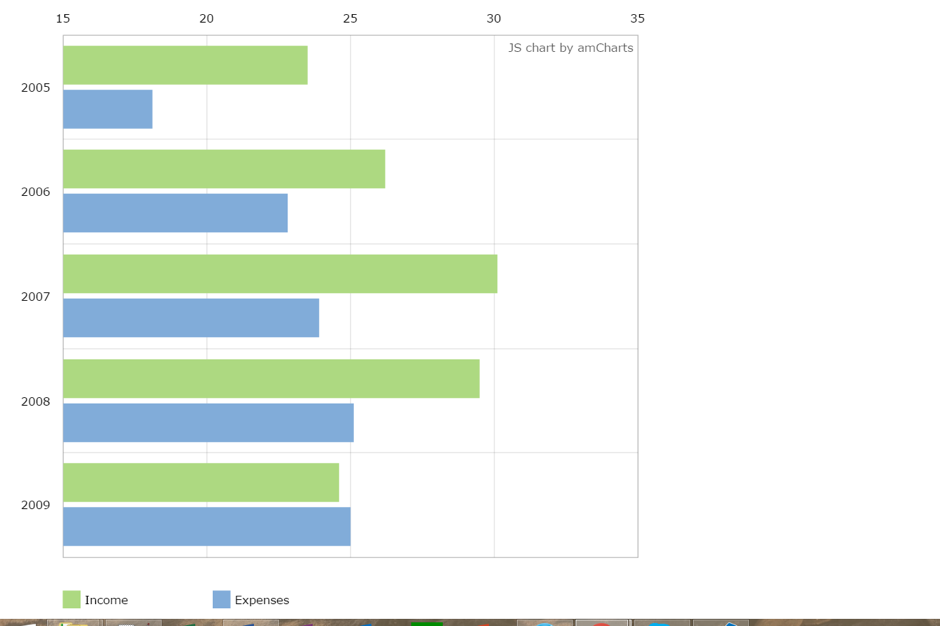
amCharts have two configuration styles; one is with json object and the other is configuration through the library API (JavaScript). Basically, the json object is most convenient in cases where you want to set up your graph at the server, otherwise you should use the API to set up your graph. The example we see above is set up through the Javascript API of amCharts object.
<script>
    var chart;

    var chartData = [
        {
            "year": 2005,
            "income": 23.5,
            "expenses": 18.1
        },
        {
            "year": 2006,
            "income": 26.2,
            "expenses": 22.8
        },
        {
            "year": 2007,
            "income": 30.1,
            "expenses": 23.9
        },
        {
            "year": 2008,
            "income": 29.5,
            "expenses": 25.1
        },
        {
            "year": 2009,
            "income": 24.6,
            "expenses": 25
        }
    ];


    AmCharts.ready(function () {
        // SERIAL CHART
        chart = new AmCharts.AmSerialChart();
        chart.dataProvider = chartData;
        chart.categoryField = "year";
        chart.startDuration = 1;
        chart.plotAreaBorderColor = "#DADADA";
        chart.plotAreaBorderAlpha = 1;
        // this single line makes the chart a bar chart
        chart.rotate = true;

        // AXES
        // Category
        var categoryAxis = chart.categoryAxis;
        categoryAxis.gridPosition = "start";
        categoryAxis.gridAlpha = 0.1;
        categoryAxis.axisAlpha = 0;

        // Value
        var valueAxis = new AmCharts.ValueAxis();
        valueAxis.axisAlpha = 0;
        valueAxis.gridAlpha = 0.1;
        valueAxis.position = "top";
        chart.addValueAxis(valueAxis);

        // GRAPHS
        // first graph
        var graph1 = new AmCharts.AmGraph();
        graph1.type = "column";
        graph1.title = "Income";
        graph1.valueField = "income";
        graph1.balloonText = "Income:[[value]]";
        graph1.lineAlpha = 0;
        graph1.fillColors = "#ADD981";
        graph1.fillAlphas = 1;
        chart.addGraph(graph1);

        // second graph
        var graph2 = new AmCharts.AmGraph();
        graph2.type = "column";
        graph2.title = "Expenses";
        graph2.valueField = "expenses";
        graph2.balloonText = "Expenses:[[value]]";
        graph2.lineAlpha = 0;
        graph2.fillColors = "#81acd9";
        graph2.fillAlphas = 1;
        chart.addGraph(graph2);

        // LEGEND
        var legend = new AmCharts.AmLegend();
        chart.addLegend(legend);

        chart.creditsPosition = "top-right";

        // WRITE
        chart.write("chartdiv");
    });
</script>
At the end of the code, we can see the call to write function. Write is a command passed to the rendering engine specifying the div tag where we want the chart to be rendered.
So now lets create two files in the charts folder that will contain logic and template for our chart (.js and .js.map files are generated by typescript compiler):

Now place the following code in the .ts file:
/// <reference path="../../typings/AmCharts.d.ts" />


import {Component, AfterViewInit} from '@angular/core';

@Component({
    selector: 'bar-clustered',
    templateUrl: 'app/charts/BarClustered.component.html'
})
export class BarClusteredComponent implements AfterViewInit{

    constructor() {}

    ngAfterViewInit() {
        var chart: any;

        var chartData = [
            {
                "year": 2005,
                "income": 23.5,
                "expenses": 18.1
            },
            {
                "year": 2006,
                "income": 26.2,
                "expenses": 22.8
            },
            {
                "year": 2007,
                "income": 30.1,
                "expenses": 23.9
            },
            {
                "year": 2008,
                "income": 29.5,
                "expenses": 25.1
            },
            {
                "year": 2009,
                "income": 24.6,
                "expenses": 25
            }
        ];


        if (AmCharts.isReady) {
            createChart();
        } else {
            AmCharts.ready(function () {
                createChart();
            });
        }


    function createChart() {
        // SERIAL CHART
        chart = new AmCharts.AmSerialChart();
        chart.dataProvider = chartData;
        chart.categoryField = "year";
        chart.startDuration = 1;
        chart.plotAreaBorderColor = "#DADADA";
        chart.plotAreaBorderAlpha = 1;
        // this single line makes the chart a bar chart
        chart.rotate = true;

        // AXES
        // Category
        var categoryAxis = chart.categoryAxis;
        categoryAxis.gridPosition = "start";
        categoryAxis.gridAlpha = 0.1;
        categoryAxis.axisAlpha = 0;

        // Value
        var valueAxis = new AmCharts.ValueAxis();
        valueAxis.axisAlpha = 0;
        valueAxis.gridAlpha = 0.1;
        valueAxis.position = "top";
        chart.addValueAxis(valueAxis);

        // GRAPHS
        // first graph
        var graph1 = new AmCharts.AmGraph();
        graph1.type = "column";
        graph1.title = "Income";
        graph1.valueField = "income";
        graph1.balloonText = "Income:[[value]]";
        graph1.lineAlpha = 0;
        graph1.fillColors = "#ADD981";
        graph1.fillAlphas = 1;
        chart.addGraph(graph1);

        // second graph
        var graph2 = new AmCharts.AmGraph();
        graph2.type = "column";
        graph2.title = "Expenses";
        graph2.valueField = "expenses";
        graph2.balloonText = "Expenses:[[value]]";
        graph2.lineAlpha = 0;
        graph2.fillColors = "#81acd9";
        graph2.fillAlphas = 1;
        chart.addGraph(graph2);

        // LEGEND
        var legend = new AmCharts.AmLegend();
        chart.addLegend(legend);

        chart.creditsPosition = "top-right";

        // WRITE
        chart.write("chartdiv");
        }
    }
}
And the following code in the template file:
<div>
    <h2>Hello From Bar Clustered Component</h2>
    <div id="chartdiv" style="width:50%; height:600px;"></div>
</div>
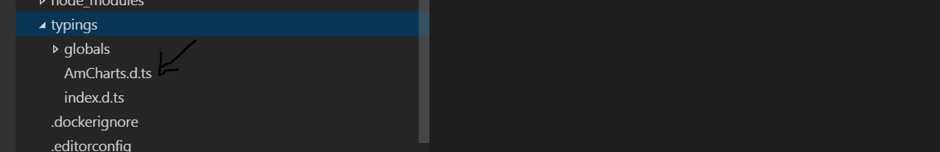
As you can see, we are using typings to benefit from the typescript functionalities (which is elaborated clearly in this Quora question). Download the typings here, and place it in the typings folder that is located at the root of our application:
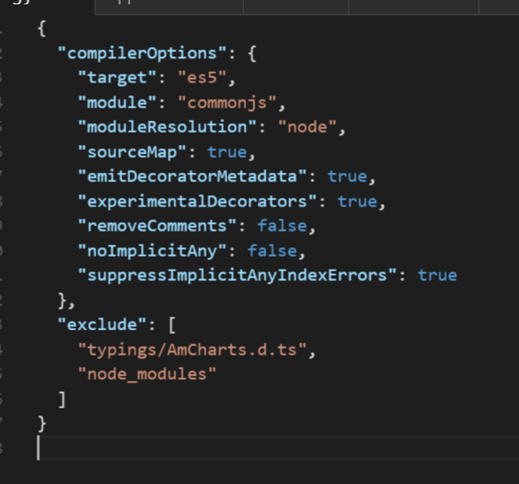
Now if we try to run the command to compile the typescript files of our folders (npm run tsc), we will see a lot of errors. Solve these erros by going to the tsconfig.json and changing the code a little bit:
Now we need to change some amCharts typings (because typings are incomplete). Add the following code in the line 30 of the typings file:
var ready: any;
var isReady: any;
Everything should look okay now; let’s proceed.
Implementing routing for our app
For this step, let’s first create a new file called app.routes.ts to implement a constant array that will contain all routes:
import {BarClusteredComponent } from './charts/BarClustered.component';

export const AppRoutes = [
    {path: 'charts/barclustered', component: BarClusteredComponent}
];
After this step, import the provideRouter and AppRoutes modules in the main.ts file:
import { AppRoutes } from './app.routes';
import { provideRouter } from '@angular/router';
And now let’s provide our routes set to the application:
bootstrap(AppComponent, [
    provideRouter(AppRoutes)
]);
Now in the app.component.ts file, import ROUTER_DIRECTIVES, which is simply a predefined list of directives we can add to a component’s template.
Let’s add a <router-outlet> tag to our component’s template so that loaded components are displayed accordingly.
<div>
    <router-outlet></router-outlet>
</div>
Now specify the link of the routes so we can access them by clicking the button; one of the simplest ways to do this is to:
<button routerLink="charts/barclustered" type="button">Bar Clustered Chart</button>
If you can’t follow the development flow or you’re having some errors, check the final code structure below.
Ng Lifecycle hooks
If there is an error saying that the value for APP_BASE_HREF wasn’t provided, we need to specify the path separator for our router, the standard one is ‘/’ (slash)
Add the following code in the index.html (before the head opening tag) :
<base href="/">
Now there’s another error! But everything seems to be okay, what exactly is going on? The problem here is that the router requires a default route, with path:’’.
Normally, this would be your main page or welcome component, but for this amCharts tutorial, let’s create an empty component.
In the chart folder, create: EmptyRoute.component.ts file and populate it with the following code:
import { Component } from '@angular/core';

@Component({
    selector: 'empty-component',
    template: `
    <h1>I'm empty</h1>
    `
})
export class EmptyRouteComponent { }
And in the app.routes.ts file, add an empty default route with the following code:
import {EmptyRouteComponent } from './charts/EmptyRoute.component';
{path: '', component: EmptyRouteComponent },
Run the app npm again from the start. Don’t forget to run the compiler command to recompile your .ts files into .js files (npm run tsc).
Okay, great now the app is running fine. So let’s click the Bar Clustered Chart button and see what happens… more errors? Ouch! What is going on???

Well, my friends, that is development.
Basically at this step, when we are trying to activate the component (yes it’s called activation) at our route, even when we have typings (this is only for typescript transpiler), we don’t have our graphs libraries defined. Let’s check in the sample chart file and see what libraries we need for that:

And let’s include (correcting path) these lines to our index.html:
<!-- Importing amcharts -->
    <script src="amcharts/amcharts/amcharts.js" type="text/javascript"></script>
    <script src="amcharts/amcharts/serial.js" type="text/javascript"></script>
Let’s run it again, et voilà our graph is here.
Note: If for some reason at this step your receive an error like: listen EADDRINUSE :::3000, kill the node server process and restart your computer and everything will be fine.
Implementing maps using AmMap
Now let’s talk a little bit about AmMaps. Basically, the procedure is pretty much the same. If you want to implement AmMap in ng2 you should follow the exact same steps as for the amCharts tutorial described above with some slight nuances which I will point out.
The download page is the same but this time, download AmMap. This contains all the code you will need as well as a folder full of samples. Reminder: don’t forget to include the index page references to the necessary libraries.
While implementing the AmMap first issue, you may discover that the typings we used in this amCharts tutorial does not contain definitions for AmMap. At the moment of this writing, I was unable to find any good example of typings for AmMap, so my suggestion would be to go directly to the file of AmCharts.d.ts and add all definitions necessary for the typescript compiler (if you’re confused or don’t know what to do, you can find the full code for this example at this GitHub repository.
Thank you all and good luck with your coding!
Anton…
Any samples of connecting this chart to websockets data feed?
Great tutorial, i implemented my own chart about 5 minute with this, You are the king of time savers. Thanx :)
Question: for Angular 2, is including a third party script externally the “correct way” to include a script?