Visualizing Data in React.js: Cross-Filtering & Adding Mouse-over Interaction

Through a real-world example project that visualizes Bitcoin transactions, this React.js tutorial is a step-by-step guide on how to add mouse-over interaction to a histogram so that it would show the date and correlating event on hover.
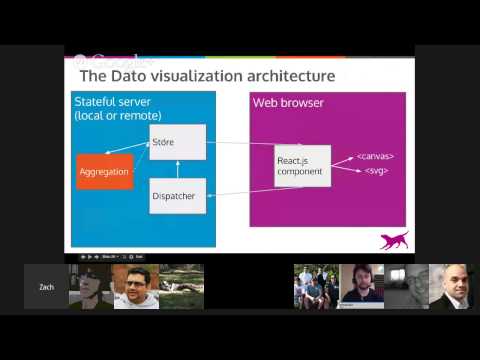
Codementor Office Hours hosted by Zach Nation, a software engineer at Dato.
You can download the demo code on Github and follow along the second half of the Office Hours video or through the text version below. For more information on steps to doing scalable data visualization in React, read part 1.
(the live coding starts around 33:07)
The Demo Project: Bitcoin Transactions

The data above is a hex dump of a real world example on Bitcoin transactions. It’s a larger data set than you could typically fit in a browser, so I think it’s representative of the types of challenges that we’re facing. It’s sequentially arranged which means we can visualize it while streaming the data through.
Parsing the Blockchain
For the most part, the hex dump above is binary data, so it’s hard to make sense of. However, I did start to notice a pattern: this repeating F9BEB4D9.

That’s actually the magic header for each block in the blockchain. A Bitcoin blockchain is essentially one long array of blocks, and each block represents a set of transactions on Bitcoin. In other words, it’s a giant public ledger that everyone writes to by performing transactions and all of the data is stored sequentially here and it can be parsed out. I actually wrote some JavaScript code to parse the data, loaded it up into GraphLab Create as an S frame, and got some really useful display of what was actually going on in that file.

As you can see, we have about forty-five million rows. This has now been parsed out into individual transactions. We have transactions numbers, and each transaction has a timestamp and an amount. There are some other data as well in that blockchain that I did not include here just for brevity (e.g. a to and a from address). Essentially, you can think of this as a long list of transactions and transaction amounts.
How the Data is Visualized
The demo is a small component I built to show the total number of Bitcoin transactions per day over time, and I have a node server going in the background that’s processing this blockchain. In other words, this demo actually using the node binary to parse the raw blockchain.
It helps that the Bitcoin blockchain is arranged sequentially over time because we can stream through the whole file in a single linear pass and we don’t have to do any more complicated transformations to get a good visualization out of the data.

As you see, the demo gives me a histogram showing the total Bitcoin transaction amount per day, so we’re binning on each day and then throwing a bar for each day that happened historically. At the same time, we have a history log, which will update over time as we move into the future in the blockchain.
I also found a Wiki page that detailed the history of Bitcoin, and I just took down what was the date on which each event occurred. In my React component, I am filtering on the max date of what’s being displayed here to know what to display in this component as well.
However, what I really would like to know is which bars correspond exactly to which history items because it’s a little bit hard to tell.
Cross-Component States in Visualization
So what I’m going to do is plumb through some state in this React component that can know what I’m currently hovering on with my mouse and highlight both the bar down here and the bars up the histogram that correlate to each other. So this is kind of what’s known as like a cross-filter or a cross-component state in visualization.
Here is the main client-side component, dashboard.jsx:
'use strict';

var React = require('react/addons');
var cx = React.addons.classSet;
var ws = require('ws');

var Histogram = require('./transactions_by_date.jsx');
var History = require('./history.jsx');
var config = require('../transactions_by_date.js').config;
var hist = require('../transactions_by_date.js').histogram;

module.exports = React.createClass({
  getInitialState: function() {
    return {
      histogram: hist(new ArrayBuffer(config.TOTAL_BYTES)),
    };
  },
componentDidMount: function() {
    var wsc = new ws('ws://localhost:8081');
    wsc.binaryType = 'arraybuffer';
    wsc.onmessage = function(message) {
      this.setState({ histogram: hist(message.data) });
    }.bind(this);
  },
  render: function() {
    return (
      <div className="container">
        <div className="row">
          <div className="col-xs-12">
            <h1>Scalable Data Visualization</h1>
            <h2>Total Bitcoin transaction amount per day</h2>
          </div>
        </div>
        <br />
        <div className="row">
          <div className="col-xs-12">
            <Histogram
              data={ this.state.histogram }
            />
          </div>
          <div className="col-xs-12">
            <History
              now={ this.state.histogram.domain[1] }
            />
          </div>
        </div>
      </div>
    );
  }
});
I’ve got React and a web socket module, and a few React components. The Histogram component is the transactions by date, which is a live-updating bar chart. The History component is the ticker of events that happened in the past. Then I’ve got some configuration, and the hist function, which is a wrapper around the raw data that comes back over web socket.
You’ll notice I have component state that is currently keeping track of the actual data coming back over web socket. I start out with an empty array of the right size for that histogram
histogram: hist(new ArrayBuffer(config.TOTAL_BYTES)),
and then on message received over web socket, I’m just going to do set state and I’m going to set that histogram to whatever message actually came back:
wsc.onmessage = function(message) {
      this.setState({ histogram: hist(message.data) });
    }.bind(this);
The server is responsible for constructing a typed array representation of this data, and then pushing it to the web socket.
Finally, I picked a threshold so every few seconds this app will be updated with more data. However, I think we need a little more state in this component to be able to represent where I’m hovering with the mouse to be able to correlate individual bars here to this here. So I’m going to add a piece of state to t this component state called hoverDate, and I’m going to set that to null just to start with.
      histogram: hist(new ArrayBuffer(config.TOTAL_BYTES)),
      hoverDate: null
And then, I’m going to add a function on hover that takes a date
  onHover: function(date) {
    this.setState({hoverDate: date});
  },
This way, we will be keeping track of whatever data’s being hovered on in this component. Then, I’m going to pass that in as a property to the history component.
            <History
              now={ this.state.histogram.domain[1] }
              onHover={this.onHover}
            />
So now I have a function being passed into my history object history.jsx, and so I can use that in here from props.
'use strict';

var React = require('react/addons');
var ReactCSSTransitionGroup = React.addons.CSSTransitionGroup;
var moment = require('moment');

// events from https://en.bitcoin.it/wiki/History
var events = [
  [new Date(2009, 0, 3), 'Genesis block established at 18:15:05 GMT'],
  [new Date(2009, 0, 9), 'Bitcoin v0.1 released and announced on the cryptography mailing list'],
  [new Date(2009, 0, 12), 'First Bitcoin transaction, in block 170 - from Satoshi to Hal Finney'],
  [new Date(2009, 9, 5), 'Exchange rates published by New Liberty Standard. $1 = 1,309.03 BTC'],
  [new Date(2009, 9, 9), '#bitcoin-dev channel registered on freenode IRC'],
  [new Date(2009, 11, 16), 'Bitcoin v0.2 released'],
  [new Date(2009, 11, 30), 'First difficulty increase at 06:11:04 GMT'],
  [new Date(2010, 1, 6), 'Bitcoin Market established'],
  [new Date(2010, 4, 22), 'laszlo first to buy pizza with Bitcoins agreeing upon paying 10,000 BTC for ~$25 worth of pizza courtesy of jercos'],
  [new Date(2010, 6, 7), 'Bitcoin v0.3 released'],
  [new Date(2010, 6, 11), 'Bitcoin v0.3 release mentioned on slashdot[5], bringing a large influx of new bitcoin users'],
  [new Date(2010, 6, 12), 'Beginning of a 10x increase in exchange value over a 5 day period, from about $0.008/BTC to $0.08/BTC'],
  [new Date(2010, 6, 17), 'MtGox established'],
  [new Date(2010, 6, 18), 'ArtForz generated his first block after establishing his personal OpenCL GPU hash farm'],
  [new Date(2010, 7, 15), 'Bug in the bitcoin code allows a bad transaction into block 74638. Users quickly adopt fixed code and the "good" block chain overtook the bad one at a block height of 74691, 53 blocks later'],
  [new Date(2010, 8, 14), 'jgarzik offered 10,000 BTC (valued at ~$600-650) to puddinpop to open source their windows-based CUDA client'],
  [new Date(2010, 8, 14), 'Block 79,764 is first to be mined using split allocation of the generation reward'],
  [new Date(2010, 8, 18), 'puddinpop released source to their windows-based CUDA client under MIT license'],
  [new Date(2010, 8, 29), 'kermit discovered a microtransactions exploit which precipitated the Bitcoin v0.3.13 release'],
  [new Date(2010, 9, 1), 'First public OpenCL miner released'],
  [new Date(2010, 9, 4), 'Original Bitcoin History wiki page (this page) established (ooh so meta) on Bitcoin.org\'s wiki'],
  [new Date(2010, 9, 7), 'Exchange rate started climbing up from $0.06/BTC after several flat months'],
  [new Date(2010, 9, 16), 'First recorded escrowed bitcoin trade conducted, between nanotube and Diablo-D3, escrowed by theymos'],
  [new Date(2010, 9, 17), '#bitcoin-otc trading channel established on freenode IRC'],
  [new Date(2010, 9, 28), 'First bitcoin short sale transaction initiated, with a loan of 100 BTC by nanotube to kiba, facilitated by the #bitcoin-otc market'],
  [new Date(2010, 10, 6), 'The Bitcoin economy passed US $1 million. The MtGox price touched USD $0.50/BTC'],
  [new Date(2010, 11, 7), 'Bitcoind was compiled for the Nokia N900 mobile computer by doublec. The following day, ribuck sent him 0.42 BTC in the first portable-to-portable Bitcoin transaction'],
  [new Date(2010, 11, 9), 'The generation difficulty passed 10,000'],
  [new Date(2010, 11, 9), 'First bitcoin call option contract sold, from nanotube to sgornick, via the #bitcoin-otc market'],
  [new Date(2010, 11, 16), 'Bitcoin Pooled Mining, operated by slush, found its first block']
];
events.reverse(); // will display backwards (newest on top)

module.exports = React.createClass({
  render: function() {
    return (
      <ul className="list-group">
        <ReactCSSTransitionGroup transitionName="history-events">
          {events.filter(function(evt) {
            return evt[0].getTime() <= this.props.now;
          }.bind(this)).map(function(evt) {
            var date = evt[0];
            var text = evt[1];
            return (
              <li className="list-group-item" key={text} >
                <span className="label label-primary">
                  {moment(date).calendar()}
                </span>
                <span>{text}</span>
              </li>
            );
          }.bind(this))}
        </ReactCSSTransitionGroup>
      </ul>
    );
  }
});
I’ve actually just hard-coded a list of events that I got from Bitcoin’s Wiki history. I’m going to bind on hover for each history item to the date.
<li
                className="list-group-item"
                key={text}
                onMouseOver={this.props.onHover.bind(null, date)}
>
Just to make sure all this would work, we’ll log the events in the dashboard.jsx component:
  onHover: function(date) {
    console.log(date);
    this.setState({hoverDate: date});
  },
Now that we’ve added all these code, whenever I hover over a list item in history, we should get an event giving you the date of these components (you can see this if you open up your web console).

That’s getting stored as state on that top-level dashboard component.
Highlighting Items on Hover
Highlighting the List Items
Let’s now try to highlight an item on our web-console to see if we can get an interesting result:

I’ve set the background color as #b0007f and the text to white. Now, we can add this in the history.jsx component:
<li
                className="list-group-item"
                key={text}
                onMouseOver={this.props.onHover.bind(null, date)}
style={{
                  backgroundColor: this.props.hoverDate === date ? '#b0007f' : 'white',
                  color: this.props.hoverDate === date ? 'white' : 'black'
                }}
              >
this.hops.hoverDate is the same thing as the date for that item. I will also make the text color correspondingly either white or black.
Overall, this is just going to set a style on that element for each list item depending on whether the date is the same date as the hover date being passed in. We’ll pass in the hover date in our dashboard.jsx
            <History
              now={ this.state.histogram.domain[1] }
              onHover={this.onHover}
              hoverDate={this.state.hoverDate}
            />
In this component it’s this.state.hoverDate instead of this.props.hoverDate because it’s local to the component. Since I’m passing it into the child component history.jsx, it’s coming in a props in history.jsx. This way, there’s always a single source of truth about who owns the data vs. who’s just getting told what it is. Now, reload the page and you can see that the rendering color will change whenever you’re hovering over an item in that top-level dashboard:

However, notice my mouse is getting stuck if I mouse over and then leave:

So, I want to set onMouseOut in our history.jsx
                onMouseOver={this.props.onHover.bind(null, date)}
                onMouseOut={this.props.onHover.bind(null, null)}
Since React is already binding its methods to the component they’re defined on, we can just pass null, and the binding that was already set will work. The null parameter binding will just reset that state to not have a particular date. And so now looking at that here, we can mouse over and then mouse out and it’ll get set back to null.

All we have left to do is to plumb that through into the histogram component itself so that we’ll get a color on hover there.
Highlighting the Histogram
This is our histogram component transactions_by_date.jsx
'use strict';
// external deps
var React = require('react');
var d3 = require('d3');
var moment = require('moment');
// internal deps
var Axis = require('./axis.jsx');
var Bars = require('./bars.jsx');
module.exports = React.createClass({
render: function() {
var data = this.props.data;
var values = data.getValues();
var width = 630;
var height = Math.floor(width/2);
if (data.domain[0] === 0) {
// no data yet
return (
<div>
<span>Loading... </span>
<span className="glyphicon glyphicon-time" aria-hidden="true"></span>
</div>
);
}
var scales = {
x: d3.scale.linear().domain([0, data.getBin(data.domain[1])]).range([0, width]),
y: d3.scale.linear().domain([0, d3.max(values)]).range([0, height])
};
return (
<div className={'histogram ' + this.props.className}>
<svg
width={width + 100}
height={height + 100}
>
<Axis
scale={scales.x}
displayScale={
d3.time.scale.utc()
.domain([new Date(data.domain[0]), new Date(data.domain[1])])
.range([0, data.getBin(data.domain[1])])
}
tickFormatter={
function(date) { return moment(date).format('MMM YY'); }
}
x={100}
y={height+1}
axis='x'
/>
<Axis
scale={scales.y}
displayScale={
d3.scale.linear().domain([d3.max(values), 0]).range([0, d3.max(values)])
}
tickFormatter={
function(t) { return t.toLocaleString(); }
}
x={99}
y={0}
axis='y'
/>
          <Bars
            data={data}
            width={width}
            height={height}
            scales={scales}
            zoomIn={this.zoomIn}
          />
</svg>
</div>
);
}
});
You’ll see we’ve got some axes and then a set of bars in that component. I want to highlight the bars: transactions_by_date.jsx
<Bars
data={data}
width={width}
height={height}
scales={scales}
zoomIn={this.zoomIn}
/>
Let’s first look at our bars.jsx
'use strict';

// external deps
var React = require('react');

// utility functions
function regularArray(typedArray) {
  // TODO -- figure out how to cleanly map over typed arrays
  // without having to copy to a regular array
  var arr = new Array(typedArray.length);
  for (var i=0; i<typedArray.length; i++) {
    arr[i] = typedArray[i];
  }
  return arr;
}
function translate(x, y) {
  return 'translate(' + x + 'px,' + y + 'px)';
}

module.exports = React.createClass({
  render: function() {
    var data = this.props.data;
    var values = regularArray(data.getValues());
    return (
      <g style={{transform: 'translateX(100px)'}}>
        {values.map(function(value, idx) {
          var click = null;
          if (data.bucket !== 0 &&
              idx === 0) {
            // make the first bar clickable, to dive into the results there
            click = this.props.zoomIn;
          }
          var scaleWidth = (this.props.width/(data.getBin(data.domain[1]))) + 0.5;
          return (
            <rect
              fill='#0a8cc4'
              key={idx}
              x={0}
              y={0}
              width={1} /* size with CSS transform to allow transitions */
              height={1} /* size with CSS transform to allow transitions */
              style={{
                cursor: click === null ? 'auto' : 'pointer',
                transform: translate(
                  this.props.scales.x(idx),
                  this.props.height - this.props.scales.y(value)
                ) + ' scaleY(' + this.props.scales.y(value) + ')'
                + ' scaleX(' + scaleWidth + ')'
              }}
              onClick={click}
            />
          );
        }.bind(this))}
      </g>
    );
  }
});
We’ve got a rectangle for each date, and the value is what’s on the Y axis, while the date is going to come from the X axis. This will require a little bit more plumbing here because right now each value here doesn’t actually know its own date.
Plumbing the Data
After looking back at the top-level component, which is the dashboard.jsx, you’ll notice it has a histogram with a set of data in it, which leads you to transactions_by_date.jsx. getBin is a utility function that finds a bin relative to the minimum date value, and to look at what those values actually look like, we can use the debugger in our bars.jsx and pass in arguments: 
As you can see, the value is fifty and then the position is zero. This position is very relevant because that’s what we’re going to use. The next set of values is zero, and its position is one. Thus, for each of these positions, the index is one per day, and we’re actually just adding days to the first day in the data set.
Let’s also use the debugger in the outermost component in the histogram (transactions_by_date.jsx) to take a look at the data.domain, because I think that will have the date that we need.
    var scales = {
      x: d3.scale.linear().domain([0, data.getBin(data.domain[1])]).range([0, width]),
      y: d3.scale.linear().domain([0, d3.max(values)]).range([0, height])
    };

    debugger;
    return (
…
Now, reload the page and pass in data.domain to your web console.
![]()
As you can see, data.domain has something that looks like unit timestamps. If we keep going and look at the next time we render, we should have a bigger domain because we’ll now have processed more data. We’re starting at January 3, 2009, and then all the way up to the present. Based on the index into this set of data, we want to calculate how many days have passed to figure out whether or not to highlight the item.
We can do that by adding a highlight index (highlightIdx) to <Histogram data ={this.state.histogram} /> in our topmost component, dashboard.jsx.
Let’s calculate an example from our data in the web console.
![]()
409801000 seems to be the number of milliseconds between those two dates, so if we divide by 1000 we should get number of seconds, and dividing by 1000 * 60 should give us number of minutes, 1000 * 60 * 60 should be the number of hours, and dividing by 1000 * 60 * 60 * 24 should give us number of days. And it looks like it does. So, now our highlight index in dashboard.jsx should look like this:
            <Histogram
              data={ this.state.histogram }
              highlightIdx={
                this.state.hoverDate === null ? null : (
                  Math.floor((this.state.hoverDate - (new Date(this.state.histogram.domain[0]))) / (1000 * 60 * 60 * 24))
                )
              }
            />
Where new Date(this.state.histogram.domain[0] is the first date (the minimum date in that data set), and we’re going to divide that by (1000 * 60 * 60 * 24) to convert it from milliseconds into days. This is going to return a floating point number do a math.floor to convert it to an integer as those indexes are integers.
Now, go into transactions_by_date.jsx and pass that highlightIdx through to bars.
          var highlight = this.props.highlightIdx !== null && Math.abs(this.props.highlightIdx - idx) <= 1;
          <Bars
            data={data}
            width={width}
            height={height}
            scales={scales}
            zoomIn={this.zoomIn}
            highlightIdx={this.props.highlightIdx}
          />
All that’s left to do is go to bars.jsx to make sure they would highlight on hover.
          var scaleWidth = (this.props.width/(data.getBin(data.domain[1]))) + 0.5;
          var highlight = this.props.highlightIdx !== null && Math.abs(this.props.highlightIdx - idx) <= 1;
          return (
            <rect
              fill={highlight ? '#b0007f' : '#0a8cc4'}
              key={idx}
…
            />
If you restart your server and refresh the page, the results should render. Again, you can download the final version of the Github demo here and run it on your local server to see how things work.
Zach Nation was previously a senior software developer over at Microsoft. He is now a software engineer at Dato, previously called GraphLab, which works to help data scientists create predictive applications. Zach is working on the GraphLab Canvas, which is a large-scale data visualization tool designed to be able to display data from an SFrame of any size.